Description
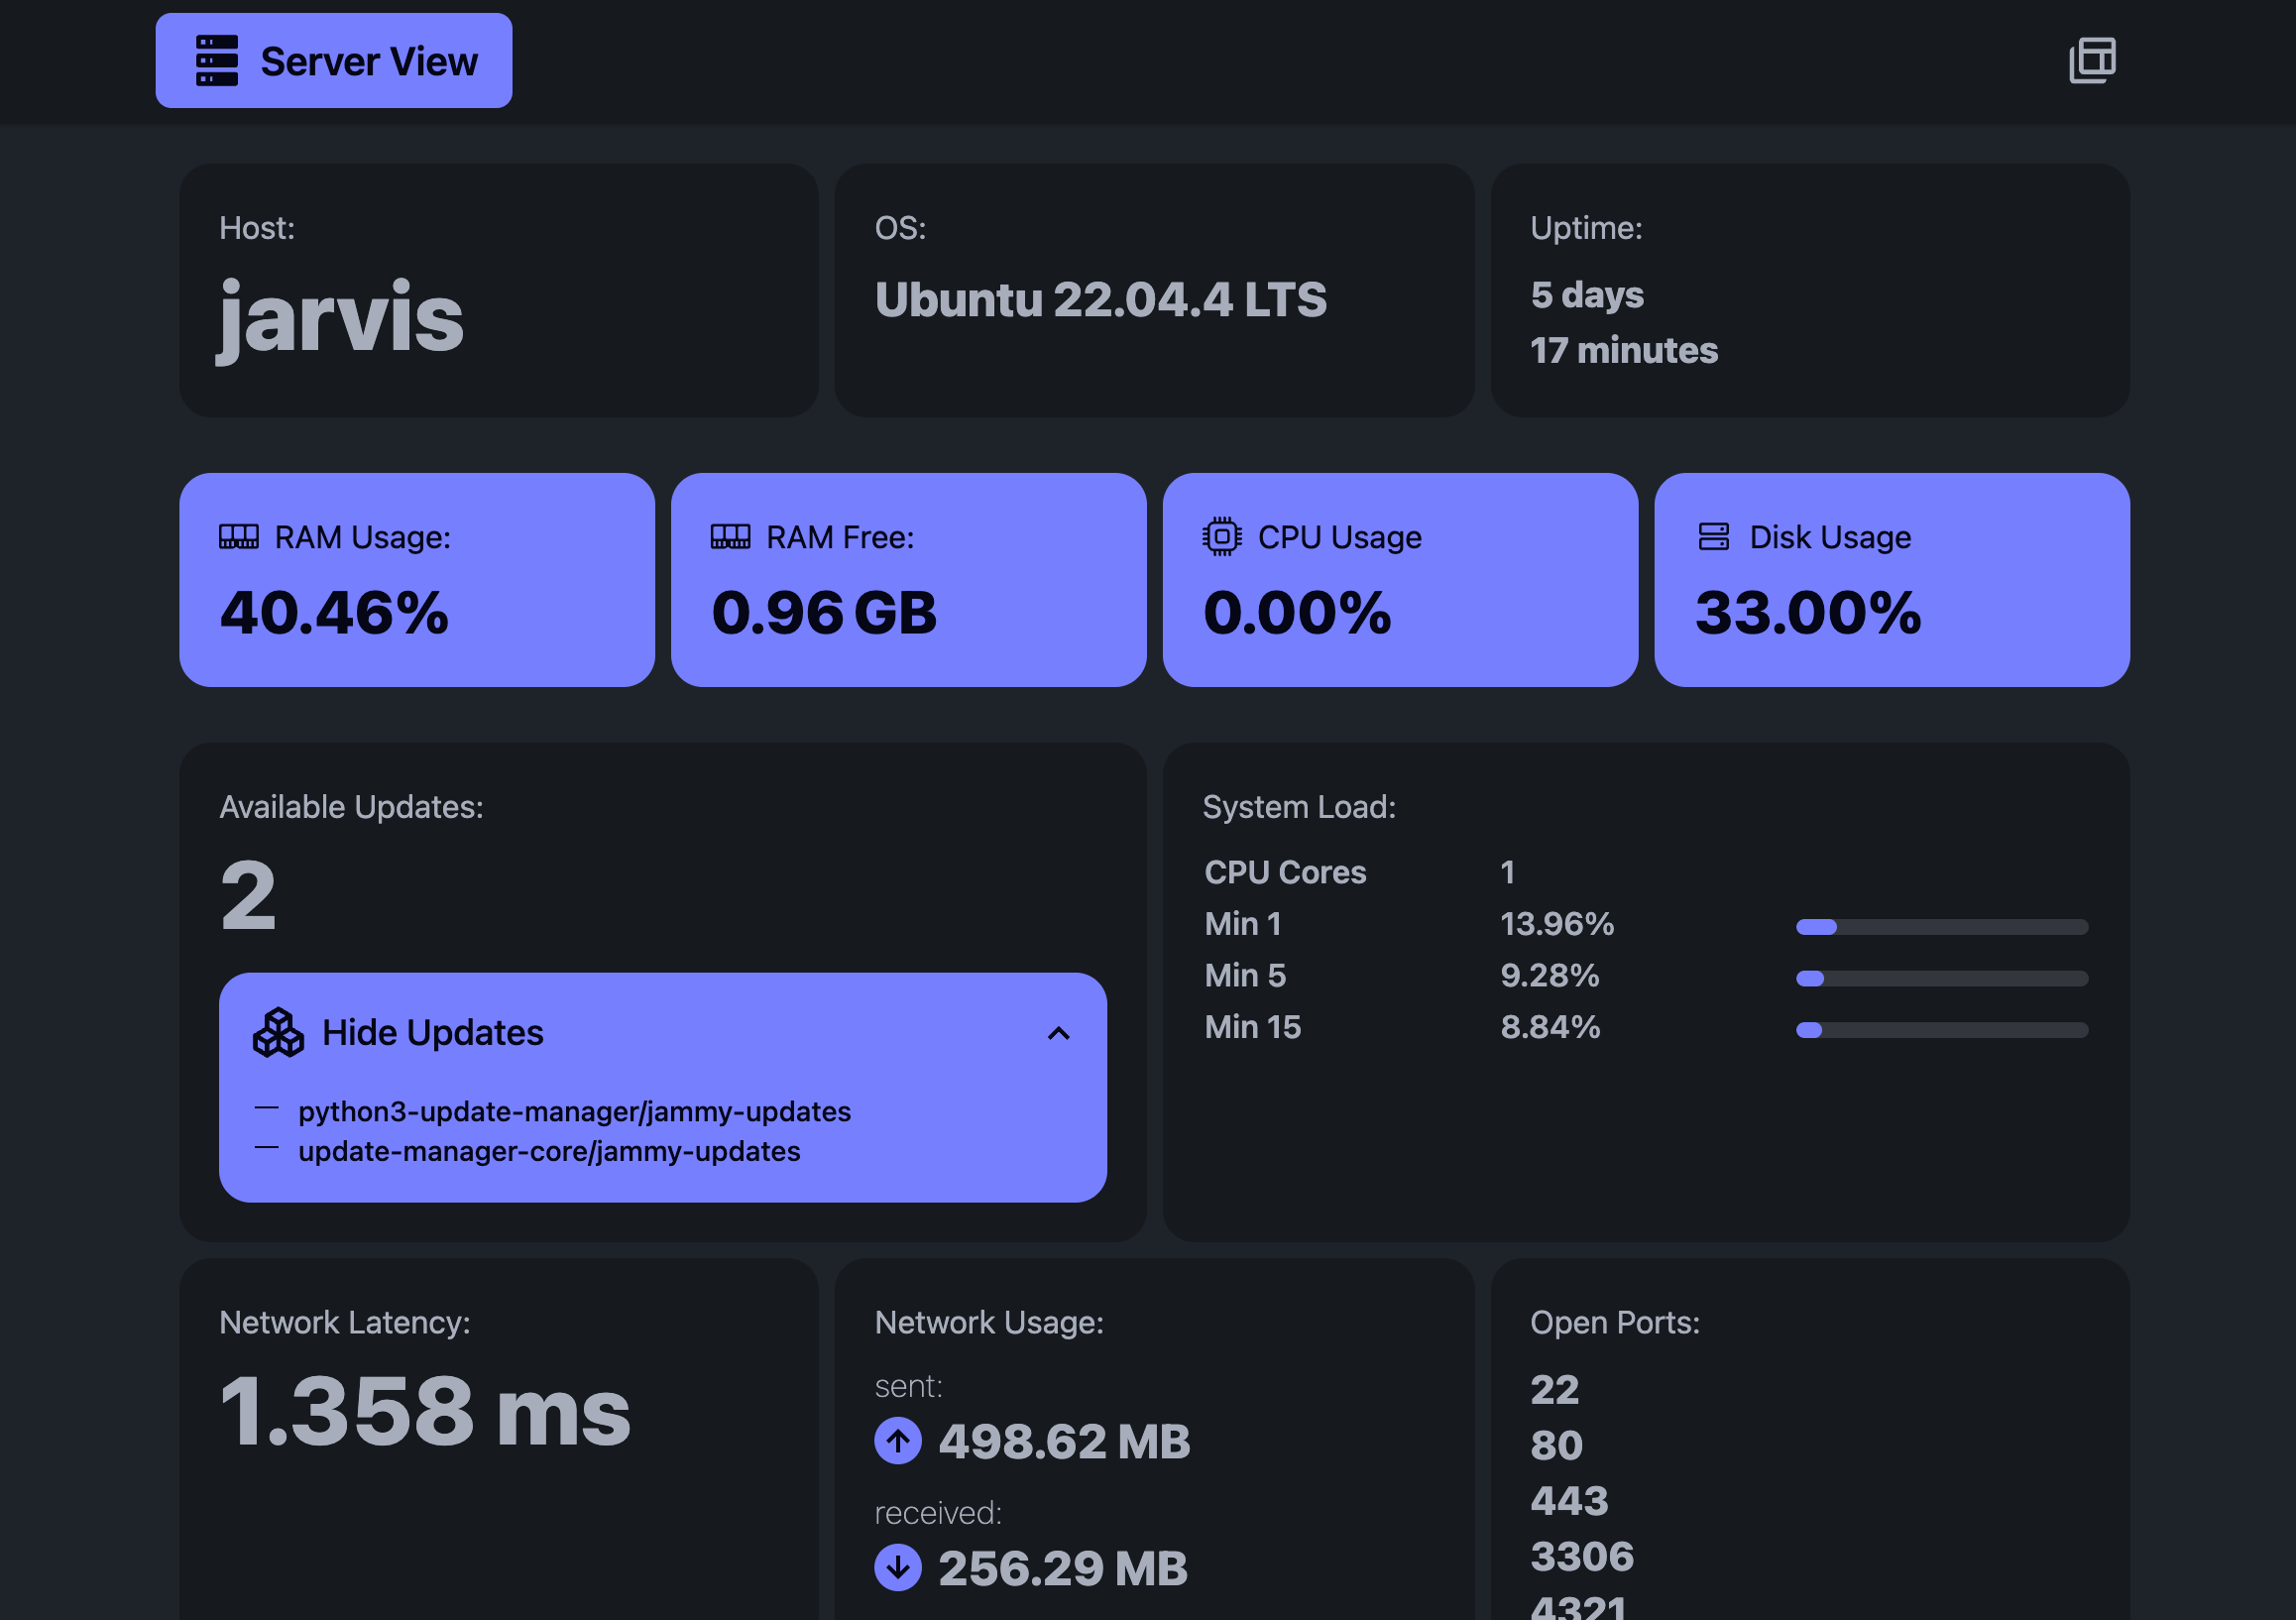
The Server Dashboard is a comprehensive tool designed to monitor and display real-time statistics about your server’s performance. It showcases the CPU and memory usage through a user-friendly interface, allowing for easy understanding and monitoring of your server’s health. This dashboard is particularly useful for system administrators and developers who need to keep an eye on server resources to ensure optimal performance and uptime.
Built using Python for the server-side logic and Svelte for the client interface, this project leverages the best of both worlds - the robustness of Python for backend operations and the reactivity of Svelte for a seamless frontend experience. The dashboard updates in real-time using WebSockets, providing immediate feedback on the server’s current state.
Key Features
- Real-time CPU and memory usage graphs.
- Easy setup and deployment on any server running Ubuntu and Nginx.
- Lightweight and responsive design, thanks to TailwindCSS.
- Open-source, with the code available on GitHub for further customization and enhancement.
Whether you’re managing a single server or a fleet, the Server Dashboard offers a simple yet powerful way to keep tabs on your infrastructure’s health, directly from your browser.
Getting Started
Requirements
- Nmap (install using your package manager)
- Glances (running in webserver mode)
Note: The server must be run as root to be able to scan the network.
Running the server
cd server
python3 -m venv venv
source venv/bin/activate
pip install -r requirements.txt
chmod +x main.py
./main.py
Running the client
# create a new project in the current directory
cd client
pnpm i && pnpm run dev --host
Building the client
To create a production version of your app:
pnpm run build
You can preview the production build with npm run preview.